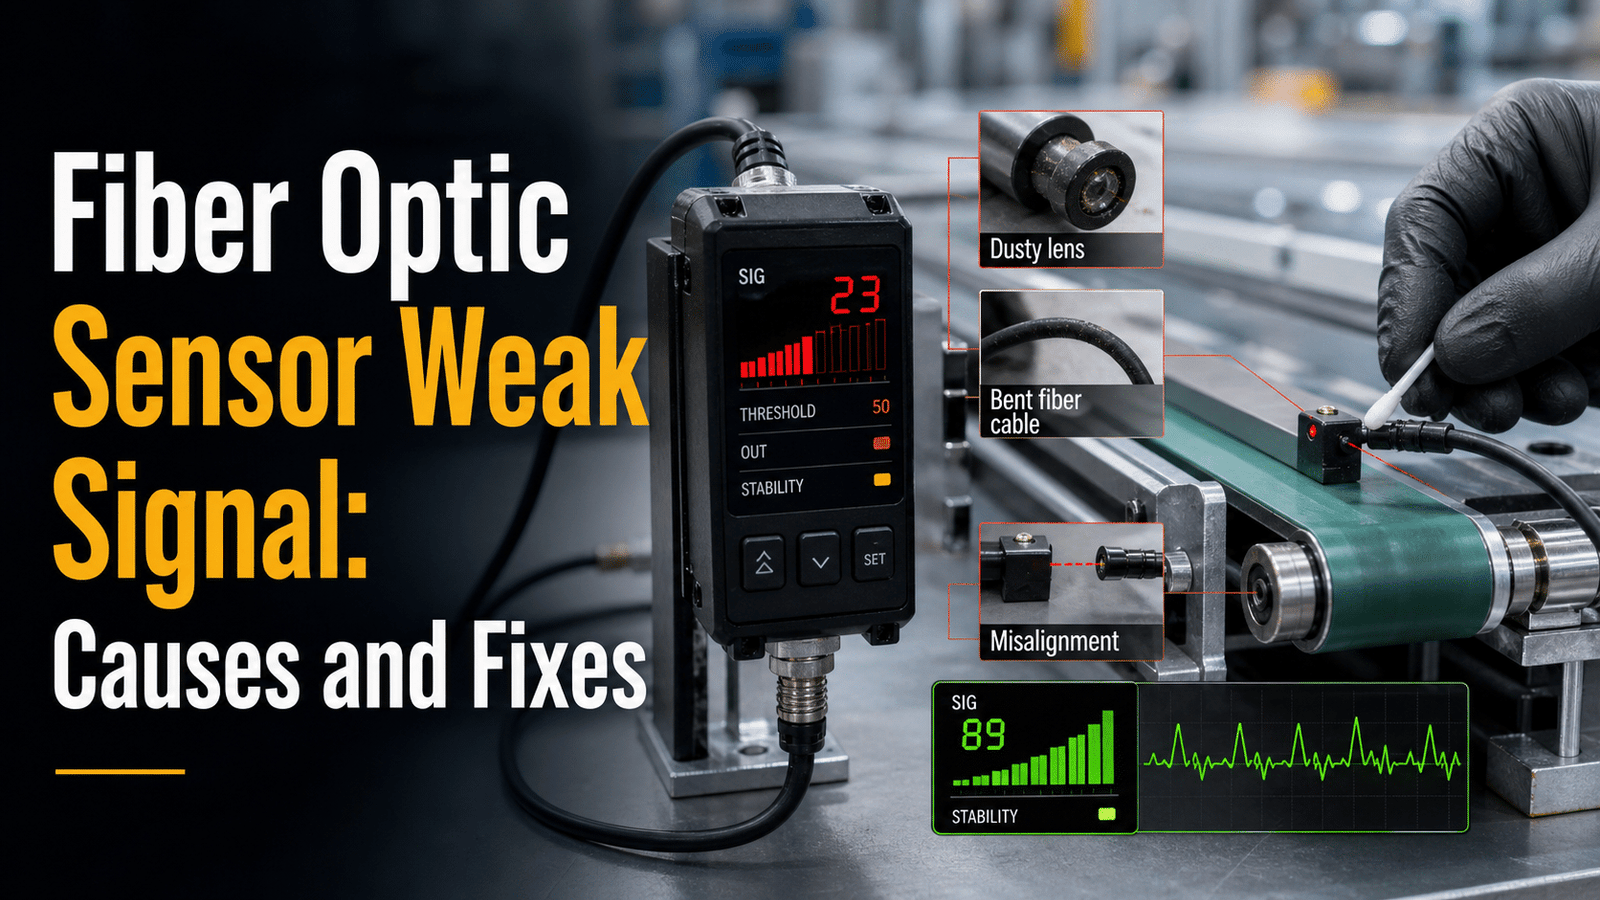
A fiber optic sensor weak signal means the received light power has dropped below a usable threshold, almost always due to physical light loss rather than electrical interference. Common causes include a dust film on the lens face, which cuts received light by double digits, or bending fiber below its 25mm[1] minimum radius, which can halve throughput. Aging LEDs, misaligned targets, and plastic fiber degradation near heat above 70°C[2] also contribute. Diagnosis starts with cleaning and alignment, not amplifier gain, which masks but never fixes the root cause.
This guide really answers the questions technicians tend to search for. What causes a weak signal to begin with? How do you diagnose it, working through it step by step? Which cleaning and alignment fixes bring the output back fastest? What amplifier and gain settings help you recover a reading that is sitting right on the edge? And when does it actually cost less to replace the fiber than to try repairing it?
Quick Takeaways
- Clean the lens face first—dust alone cuts received light by double digits.
- Keep fiber bend radius above 25mm[3] to avoid halving signal throughput.
- Diagnose weak signals with cleaning and alignment before touching amplifier gain.
- Replace plastic fiber exposed to heat above 70°C[4] to prevent degradation.
- Measure received power in dBm to confirm signal sits below threshold.
What does a weak signal in a fiber optic sensor actually mean?
A fiber optic sensor weak signal means the received light power has dropped, or the ratio of signal to background noise has fallen under the level needed for detection, but light still reaches the sensor. This is different from total loss, where no light gets to the detector whatsoever. Because fiber optic sensors spot targets by measuring how much reflected or blocked light comes back, a weak signal essentially wrecks detection accuracy well before the system quits altogether.
Received power gets measured in dBm, which is decibels compared to one milliwatt. A healthy sensor link usually runs somewhere between −20 and −25 dBm. Once that power drops down toward −35 dBm or lower, the detector really struggles to tell actual light apart from background noise. That is the point where readings begin to wander off.
Why does a weak signal cause drift before total failure?
Drift shows up because the sensor keeps reporting a value, though it is an unreliable one. As the signal to noise ratio shrinks, tiny noise wobbles get mistaken for target movement or false thresholds, so the sensor does not throw an error. Instead it quietly reports the wrong numbers. This is actually more dangerous than losing the signal completely, since a dead sensor sets off an alarm while a drifting one just corrupts data without warning. Attenuation is what drives this decline. Signal strength falls off because of dirty connectors, sharp bends, or the length of the fiber itself, and even clean single-mode fiber loses some light along the way, so weak-signal problems keep stacking up over distance.

How does a fiber optic sensor generate and transmit its signal?
A fiber optic sensor generates light at a source (a laser or LED), sends it through fiber to a sensing element, then routes the return light to a photodetector that converts it into an electrical reading. Every one of those hops loses power. Single-mode fiber alone drops about 0.2 to 0.5 dB/km, so knowing the path tells you where a fiber optic sensor weak signal starts.
Where along the path does optical power leak away?
Power drains at four spots: the source-to-fiber launch, connectors and splices, the sensing element, and the fiber run itself. Multimode fiber loses roughly 1 to 3 dB/km, up to six times more than single-mode. Air gaps at connector interfaces refract the light cone and add loss, which is why minimizing end gaps matters. Add these up and you get your total link budget.
Which physical parameter is your weak signal corrupting?
Fiber sensors read one of three things, and your weak signal attacks the one you rely on:
- Intensity modulation: the sensor tracks how much light returns. A blocked or bent path directly cuts the reading — simplest, but most fragile.
- Phase modulation: an interferometer compares light waves. Weak signal here shrinks fringe contrast, blurring the measurement.
- Wavelength modulation: fiber Bragg gratings shift color with strain or heat. Low power buries the spectral peak in noise.
Match your fix to the modulation type. A dirty connector wrecks intensity sensors first; phase sensors care more about polarization drift.
What are the common causes of weak signals in fiber optic sensing?
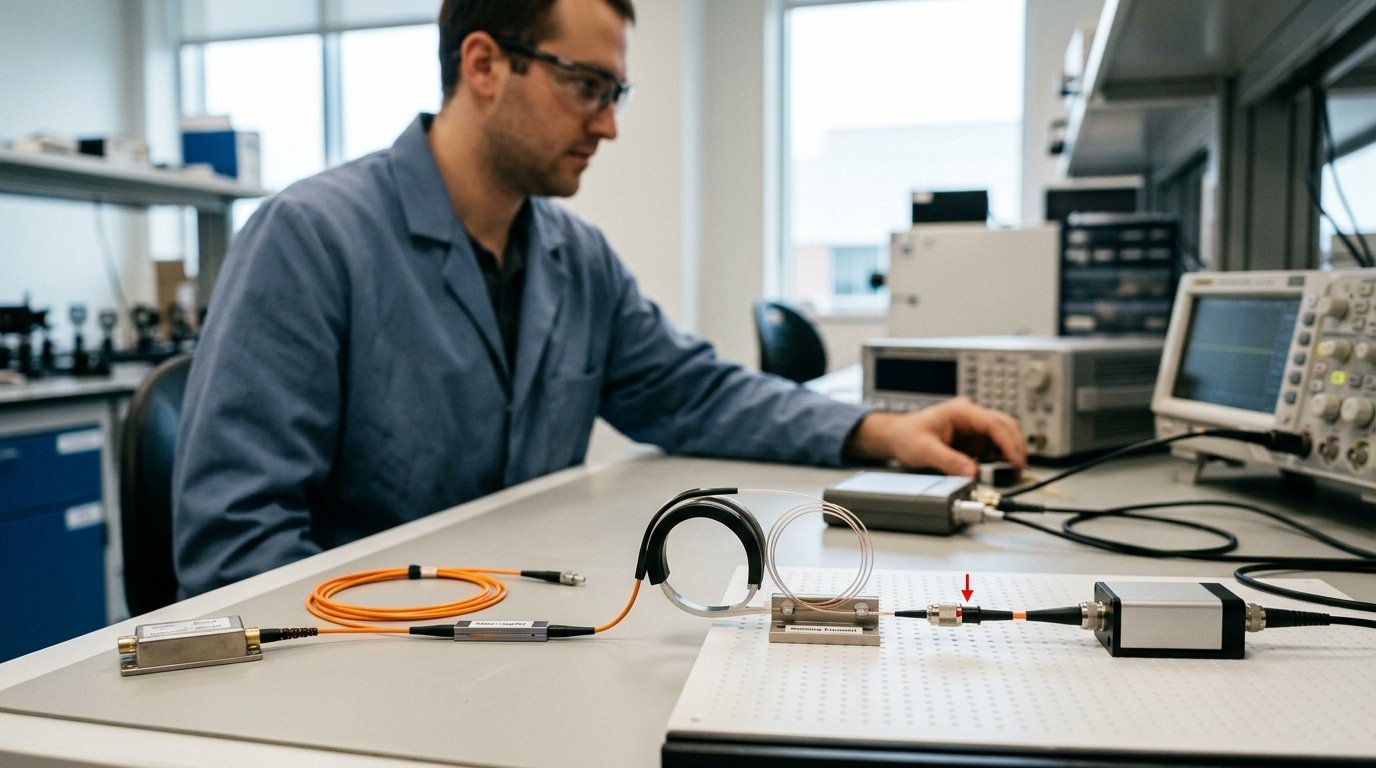
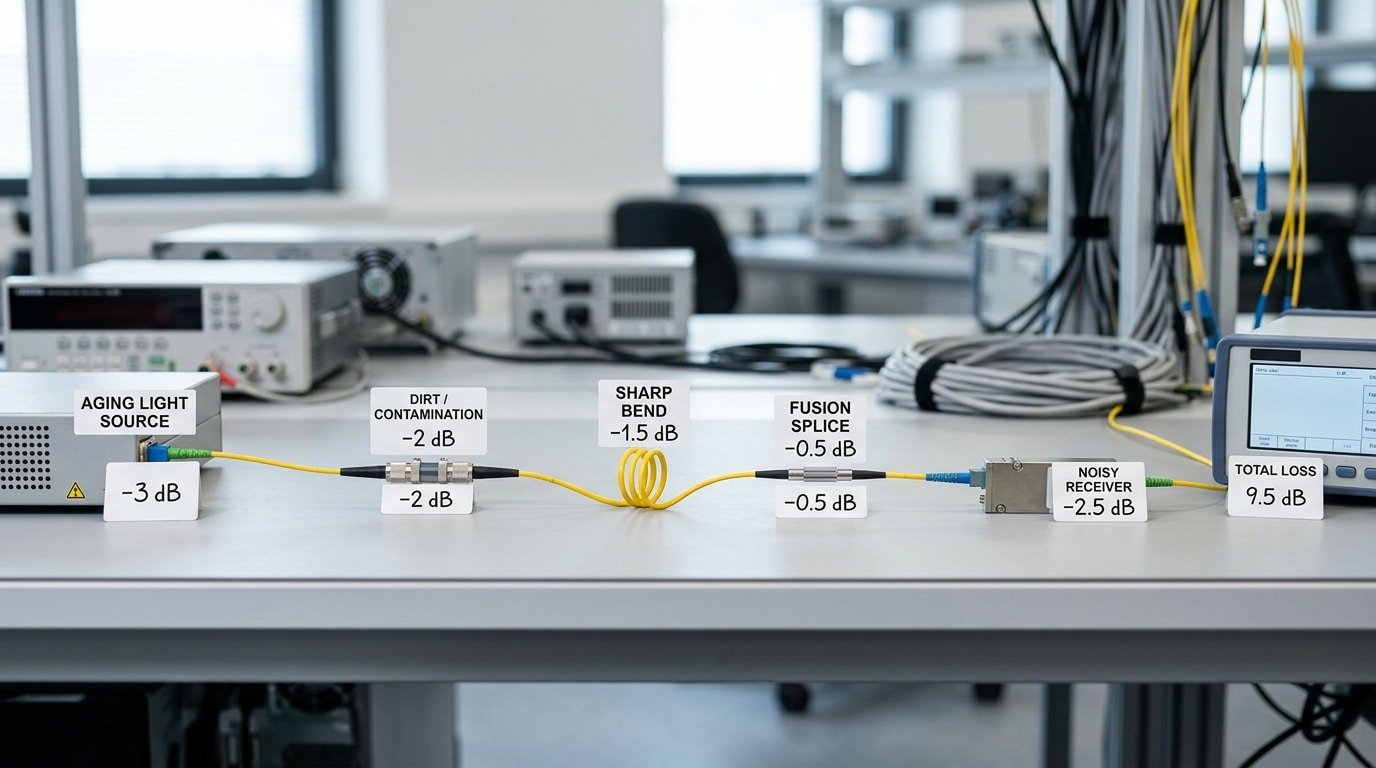
Most fiber optic sensor weak signal problems come back to five root causes, which are connector loss, fiber bending, splice attenuation, source aging, and receiver noise. Dirty or misaligned connectors, meaning the plugs where two fiber ends join together, are the single most frequent culprit, and a bad connection by itself can swallow 0.5 to 1.5 dB of light per mated pair. It really pays to check these five things before you go replacing any hardware.
Bending is the sneaky one. When the fiber is bent too sharply, light escapes from the fiber core, and the loss climbs quickly as the bend radius gets smaller. Splices, which are the permanent joints where two fibers are fused together, add smaller hits. A good fusion splice loses under 0.1 dB, while a poorly made one can lose double that amount.
Which causes drop the most signal?
Connectors and bends usually cause the biggest losses, rather than the fiber itself. The baseline loss through the fiber is low, considering single-mode fiber runs at 0.2 to 0.5 dB per kilometer and multimode runs at 1 to 3 dB per kilometer. So a short sensor cable rarely loses much power just from its length, though the joints and bends do the real damage.
- Connector loss: 0.5–1.5 dB per pair, caused by dirt, air gaps, or the connector not seating properly
- Macro/microbending: this varies quite a bit, because tight bends or a crushed jacket let light leak out of the core
- Splice loss: 0.05–0.2 dB for a fusion splice, and higher for mechanical splices
- Source degradation: a gradual drop in output as the laser or LED ages over the course of years
- Receiver noise: this raises the background level so that weak signals blend into it
How do symptoms point to the cause?
A sudden drop usually means something physical happened, like a connector getting yanked or a new bend forming. A slow decline that plays out over months points instead to the source aging or contamination slowly building up. Loss that depends on wavelength and gets worse at longer wavelengths is essentially the fingerprint of bending.
| Symptom | Likely cause |
|---|---|
| Sudden step drop | Connector unseated or new bend |
| Gradual months-long fade | Source aging or slow contamination |
| Loss rises at longer wavelengths | Macrobending |
| Noisy, jittery readings | Receiver noise or low SNR |
How do you calculate a signal budget and SNR threshold for your sensor?
A signal budget works by adding up the power coming out of your source, then subtracting every loss along the link, and finally comparing what is left against the minimum your detector can handle. When that leftover margin falls below your signal-to-noise threshold, you end up with a fiber optic sensor weak signal. It helps to set aside at least 3 dB of extra margin to account for aging components and drift caused by temperature changes.
Begin with the launch power. Say your source puts out 0 dBm, which is 1 milliwatt. From there, you subtract the losses one at a time. Fiber attenuation, meaning the signal weakening as it travels, matters most on long runs.
Single-mode fiber loses about 0.2 to 0.5 dB/km, while multimode loses 1 to 3 dB/km. And then you add connector losses, which run 0.3 to 0.75 dB each, along with splice losses at roughly 0.1 dB each.
What does a worked budget look like?
Here is a short example over a 2 km[7] single-mode link. The math shows whether the sensor really has enough headroom to work with.
| Item | Value |
|---|---|
| Source power | 0 dBm |
| Fiber loss (2 km[8] × 0.4) | −0.8 dB |
| 4 connectors × 0.5 | −2.0 dB |
| Detector sensitivity | −28 dBm |
| Remaining margin | 25.2 dB |
How much SNR margin should you reserve?
Generally, you want to keep roughly 6 dB above the detector floor if you expect reliable readings. SNR, which stands for signal-to-noise ratio, compares your actual signal against the background noise present in the system. A 25 dB margin sounds like a lot, but sensor systems pick up their targets by reading tiny changes in intensity, so noise eats into your usable range fairly quickly. It is wise to keep 3 dB aside for aging fiber and another 2 to 3 dB for temperature swings.
How do you diagnose a weak signal step by step with an OTDR and power meter?
Start with an end-to-end power meter reading, then run an OTDR to locate loss by distance, and finish by inspecting the suspect connector or splice. This three-step order isolates a fiber optic sensor weak signal in minutes instead of guessing part by part.
⚠️ Common mistake: Cranking up amplifier gain to recover a weak fiber optic signal. This happens because higher gain instantly restores the reading, so it looks fixed—but it only amplifies the same light loss from dust or tight bends, along with the noise. The fix: clean the lens face and keep bend radius above 25mm[9] first, since dust alone cuts received light by double digits.
Measure total loss first. Connect a calibrated source at one end and a power meter at the other. Subtract received power from launched power. If the number blows past your signal budget from Section 4, keep digging.
How do you read an OTDR trace to find the fault?
An OTDR (a tool that sends light pulses and times the reflections) plots loss against distance. Read the trace shape, not just the numbers. A sudden loss step means an event; a spike means a reflection.
- Gradual downward slope: normal fiber attenuation, roughly 0.2–0.5 dB/km for single-mode.
- Loss step with no reflection peak: a fusion splice or a macrobend leaking light from the core.
- Loss step with a sharp reflectance peak: a mechanical connector, often dirty or badly seated.
Bend, bad splice, or dirty connector — how do you tell them apart?
The reflectance peak decides it. A dirty connector shows a tall reflection spike because the air gap and grime bounce light back. A bend or fusion splice shows loss with little or no reflection, since no glass-to-air interface exists there. Note the fault distance, walk to that point, then inspect and clean before you replace anything.
How do you fix bends, dirty connectors, and poor splices?
Fix each fault with its own procedure: clean connectors dry-then-wet to recover 0.5,3 dB, re-route macrobends above the fiber’s minimum bend radius, and re-splice any joint losing more than 0.1 dB. Always measure loss before and after, a fiber optic sensor weak signal is only “fixed” when your power meter shows the recovery in decibels, not when the connector merely looks clean.
How do you clean a dirty connector the right way?
Dry-clean first with a lint-free cassette wipe, then wet-clean with approximately 99%[10] isopropyl alcohol only if contamination remains. Dirty ferrules are a leading cause of weaker received signal intensity. A single fingerprint or dust speck can add 0.5 to 3 dB. Inspect with a 200x scope after cleaning, the core (the light-carrying center) must be spotless.
Expect the reading to drop back toward the 0.2,0.5 dB budget for a good mated pair.
How do you correct a macrobend?
Re-route the cable so no bend goes tighter than the rated minimum radius, usually 10 times the cable diameter. Sharp bends let light escape the core. Loosening one zip-tie kink often recovers 1,2 dB instantly.
When should you re-splice a joint?
Re-splice any fusion joint above 0.1 dB or any mechanical splice above 0.3 dB. A clean re-splice should read 0.02,0.05 dB.
Cleave the fiber square first, a chipped end face causes air gaps that refract the light cone and add loss.
What signal recovery techniques boost a weak signal when the fiber can’t be fixed?
When the fiber itself can’t be repaired, four active techniques pull a usable signal out of the noise: lock-in amplification (10,60 dB SNR gain for periodic signals), coherent detection (20,30 dB for phase sensors), EDFA optical amplification (15,30 dB raw power boost), and DSP filtering (5,20 dB). Pick by signal type and noise floor, not by habit.
Lock-in amplification works only when your signal repeats at a known frequency. It multiplies the input by a reference at that frequency, then low-pass filters the result, so noise outside a razor-thin band gets rejected. This is how sensors recover a fiber optic sensor weak signal buried far below the noise floor, useful for modulated intensity or fluorescence readouts.
Coherent detection suits interferometric and phase-based sensors. It mixes the returning light with a local oscillator laser, so weak phase shifts become measurable beat signals. Because homodyne detection is limited mainly by shot noise, it reaches near-quantum sensitivity that direct detection can’t touch.
- EDFA (Erbium-Doped Fiber Amplifier): boosts optical power in the 1530–1565 nm band before detection — best when raw power, not noise, is the limit.
- DSP filtering: digital adaptive filters and averaging clean up random noise after the photodiode — cheapest, works on any signal type.
The order matters. Amplify power first with an EDFA, extract periodic signals with a lock-in, then polish what’s left with DSP. Fiber sensors already resist electromagnetic interference well, per industry sensor technology data (2026), so most residual noise is optical or thermal, target that.
What design and maintenance mistakes cause avoidable signal loss?
The costliest mistakes are silent ones: over-tightening connectors, forgetting to count every mated pair in the budget, and never recording an OTDR baseline. Each mated connector pair adds 0.3,0.75 dB, so a link with eight connectors can quietly burn 6 dB before any fault exists. Prevent this and you avoid most fiber optic sensor weak signal calls entirely.
Which install errors quietly drain your dB budget?
Over-torquing an SC or LC connector crushes the ferrule endface and grinds in micro-scratches. Those scratches scatter light and, worse, leave air-gap end faces that refract the light cone and add extra loss. Hand-tight plus a quarter turn is the standard, no pliers. The second killer is budget math: installers count fiber length and splices but skip patch-panel jumpers. Two panels with two connectors each add roughly 1.5 dB nobody planned for.
What preventive maintenance schedule keeps signals strong?
Baseline first, then re-test on a fixed cadence.
- Initial startup OTDR trace: Save the reference immediately after install — every future comparison depends on it.
- Annual power-meter check: Compare received power against baseline; a 3 dB drift flags an emerging problem before detection fails.
- Connector inspection before every mate: A 200x scope catches contamination that costs 0.5–3 dB.
- Design margin rule: Reserve 3 dB of headroom above your SNR threshold for aging, repairs, and future splices.
Log every trace. Without a baseline, you’re guessing which loss is new and which was always there.
Frequently asked questions about fiber optic sensor weak signals
A fiber optic sensor weak signal has clear answers to the most common field questions: acceptable loss depends on your margin, some causes self-recover and some never do, single-mode is more forgiving over distance, and cleaning fixes only contamination-based loss. Below are direct, tested answers.
How much loss is acceptable before the signal is too weak?
Acceptable loss is whatever keeps you above your receiver threshold with a 3 dB safety margin. Fiber itself is cheap loss: single-mode runs 0.2 to 0.5 dB/km, while multimode runs 1 to 3 dB/km. Connectors and splices add far more per point, so a total-link reading within budget matters more than any single number.
Can a weak signal recover on its own?
Sometimes. Thermal drift and moisture-driven microbending can ease when temperature or humidity normalizes. But dirt, a cracked ferrule, or a bad splice never self-heal, they only worsen. If a signal recovers overnight, log it; intermittent loss usually points to a loose connector or environmental cycling.
Is single-mode or multimode more prone to weak signals?
Multimode is more susceptible to bend loss and modal dispersion, especially past 300 meters. Single-mode tolerates distance better but punishes misalignment harder because its 9-micron core leaves no room for error. Neither is “safer”, match the fiber to your reach and connector discipline.
Will cleaning alone restore the signal?
Cleaning restores signal only when contamination caused the loss. A dry-then-wet wipe recovers 0.5 to 3 dB on a dirty ferrule. If a clean connector still reads low, the fault is a bend, splice, or damaged endface, not dirt.
Fixing weak fiber optic sensor signals — a practical recap and next steps
To fix a fiber optic sensor weak signal, follow one loop: diagnose, isolate, fix, then prevent. Standard field practice checks for dirt, damage, bends, and bad connector seating before swapping any hardware. That order alone catches most faults in under an hour.
Work the checklist in sequence. Skipping a step wastes time.
- Diagnose: Take an end-to-end power meter reading. Compare it to your link budget. A gap larger than your margin confirms a real problem, not sensor drift.
- Isolate: Run an OTDR trace to pin the loss to an exact meter. A spike means a splice or connector; a slope means a bend or aged fiber.
- Fix: Clean connectors dry-then-wet, re-splice a bad joint below 0.1 dB, or relieve any bend tighter than the cable’s minimum radius.
- Prevent: Re-inspect end faces and log the new reading. Air gaps at a connector interface refract light and add loss, so verify tight mating.
Do this now, before the next fault hits. Capture a baseline power reading and a clean OTDR trace on every link while the system runs healthy. That baseline is your reference point: when a fiber optic sensor weak signal appears later, you compare the new trace against the old one and spot the changed segment in minutes instead of guessing.
A single-mode link should hold near 0.2 to 0.5 dB per kilometer. Store that number with your baseline. If a future measurement drifts past it, you’ve proof the fiber degraded, not the reading. Set a reminder to re-baseline every six months.